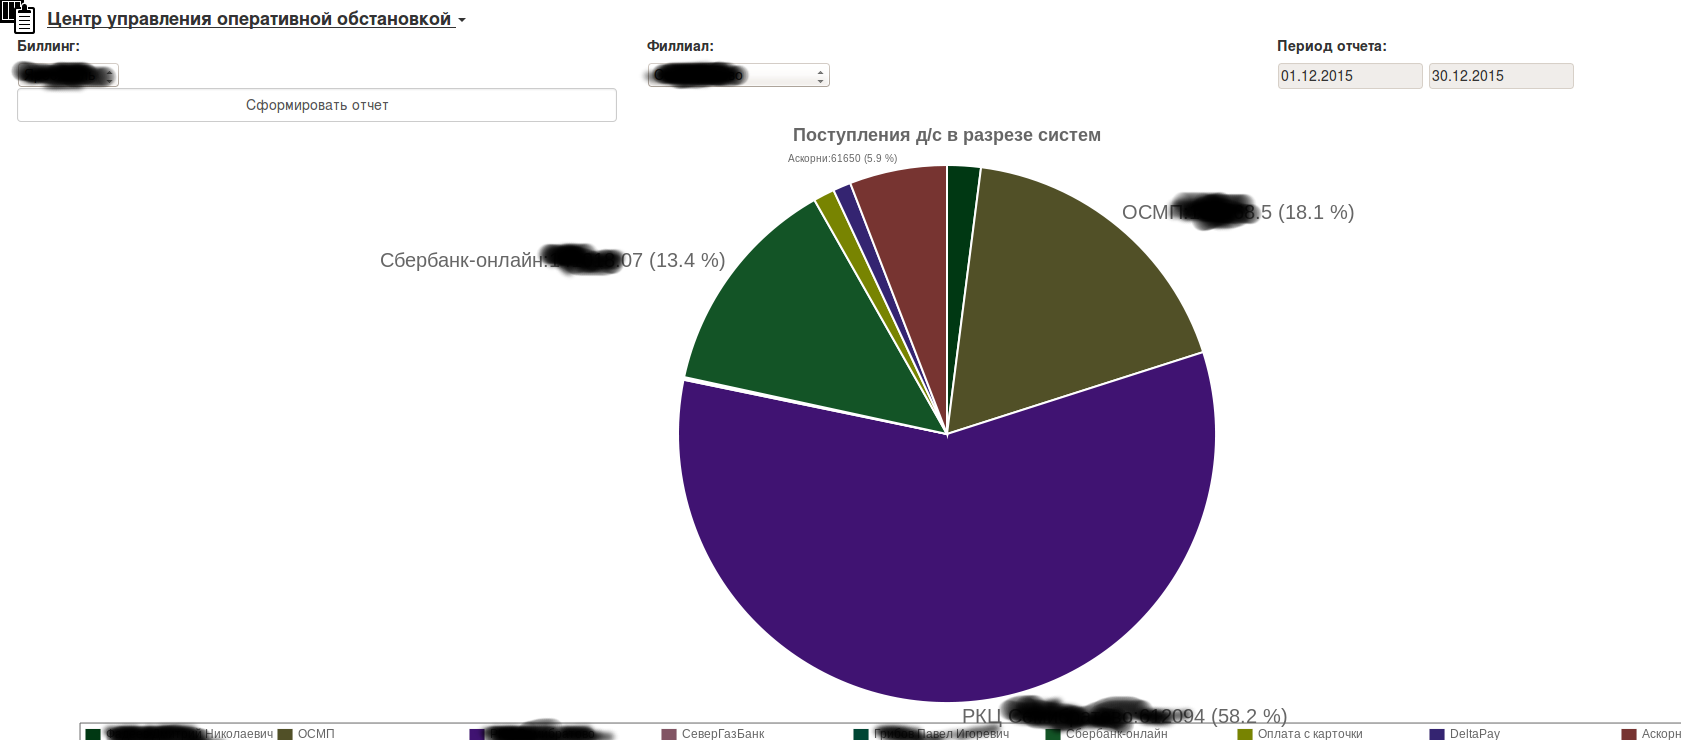
Задача: при отрисовке графика Pie, показывать надписи только для значимых значений.
Решение: повесим обработчик вывода на inGraphDataFontSize
Код:
function setFontSize(area,ctx,data,statData,posi,posj,othervars) {
	if(statData[posi].v6<=3) return(0);          // do not display the data if the slice is less than 5 %
	else if (statData[posi].v6<10)return(10);    // display with font size=10 when slice is between 5 and 10 %
	else return(20);                             // otherwise, display with font size= 20
}
var ctx = document.getElementById("myChart").getContext("2d");
var startWithDataset =1;
var startWithData =1;
var opt1 = {
      animationStartWithDataset : startWithDataset,
      animationStartWithData : startWithData,
      animateRotate : true,
      animationByData : true,
      animationSteps : 50,
      graphTitle : "Поступления д/с в разрезе систем",
      legend : true,
      inGraphDataShow : true,
      animationEasing: "linear",
      annotateDisplay : true,
      spaceBetweenBar : 5,
      graphTitleFontSize: 18,
      responsive : true,
      maintainAspectRatio : true,
      inGraphDataFontSize: setFontSize

  };
Получилось: