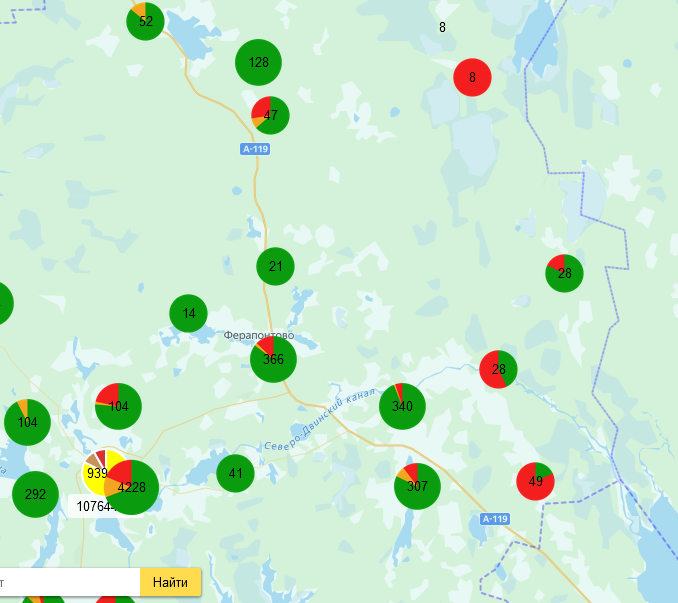
Map api yandex: иконка кластера в виде круговой диаграммы
Задача: отобразить на карте иконки кластеров в виде диаграммы построенной на основании сумм неких значений
Решение:
Используя библиотеку PieChartGD.php создадим файл вывода картинки (PHP):
<?php
include_once '../../SamChristy/PieChart/PieChartGD.php';

use SamChristy\PieChart\PieChartGD;

$chart = new PieChartGD(300, 300);

$chart->setLegend(false);

$sausages_6=$_GET["sausages_6"];
$sausages_6_12=$_GET["sausages_6_12"];
$sausages_more_12=$_GET["sausages_more_12"];

$max=$sausages_6+$sausages_12+$sausages_more_12;
$pers_6=round($sausages_6*100/$max);
$pers_6_12=round($sausages_6_12*100/$max);
$pers_more_12=round($sausages_more_12*100/$max);

$chart->addSlice('sausages_6', $pers_6, '#0a9b0e');
$chart->addSlice('sausages_6_12',    $pers_6_12, '#f3a61f');
$chart->addSlice('sausages_more_12',$pers_more_12, '#f31f1f');

$chart->draw();
$chart->outputPNG();
Далее создадим функцию отображения кластера (JavaScript):
function SetClusterProp(ob){
    console.log("-настраиваю иконки кластера");

   ob.clusters.options.set({
        gridSize: 800,
        groupByCoordinates: true,
        clusterDisableClickZoom: true,
        clusterIcons: [{
            href: 'images/m1.png',
            size: [50, 50],
            offset: [-25, -25]
        }]
    });
    ob.clusters.events.add('click', function (e) {
          console.log("Кликнули по кластеру");
          click_cluster = e.get('target');//.state.get('activeObject')
    });
    ob.clusters.events.add('add', function (e) {
       var cluster = ob.clusters.getById(e.get('objectId')),
        objects = cluster.properties.geoObjects;
        if (objects.length >= 20 && objects.length < 100) {
            dz=0;sausages=0;sausages_6=0;sausages_6_12=0;sausages_more_12=0;
            for (var i = 0; i < objects.length; i++) {
              dz=dz+objects[i].properties.dz;
              sausages=sausages+objects[i].properties.sausages;
              sausages_6=sausages_6+objects[i].properties.sausages_6;
              sausages_6_12=sausages_6_12+objects[i].properties.sausages_6_12;
              sausages_more_12=sausages_more_12+objects[i].properties.sausages_more_12;
            };
            ob.clusters.setClusterOptions(cluster.id, {
                clusterIcons: [{
                    href: 'images/pie.php?sausages='+sausages+"&sausages_6="+sausages_6+"&sausages_6_12="+sausages_6_12+"&sausages_more_12="+sausages_more_12,
                    size: [45, 45],
                    offset: [-22.5, -22.5]
                }]
            });
        }
        if (objects.length >= 100 && objects.length < 1000) {
            dz=0;sausages=0;sausages_6=0;sausages_6_12=0;sausages_more_12=0;
            for (var i = 0; i < objects.length; i++) {
              dz=dz+objects[i].properties.dz;
              sausages=sausages+objects[i].properties.sausages;
              sausages_6=sausages_6+objects[i].properties.sausages_6;
              sausages_6_12=sausages_6_12+objects[i].properties.sausages_6_12;
              sausages_more_12=sausages_more_12+objects[i].properties.sausages_more_12;
            };
            ob.clusters.setClusterOptions(cluster.id, {
                clusterIcons: [{
                    href: 'images/pie.php?sausages='+sausages+"&sausages_6="+sausages_6+"&sausages_6_12="+sausages_6_12+"&sausages_more_12="+sausages_more_12,
                    size: [55, 55],
                    offset: [-22.5, -22.5]
                }]
            });
        }
        if (objects.length >= 1000) {
            dz=0;sausages=0;sausages_6=0;sausages_6_12=0;sausages_more_12=0;
            for (var i = 0; i < objects.length; i++) {
              dz=dz+objects[i].properties.dz;
              sausages=sausages+objects[i].properties.sausages;
              sausages_6=sausages_6+objects[i].properties.sausages_6;
              sausages_6_12=sausages_6_12+objects[i].properties.sausages_6_12;
              sausages_more_12=sausages_more_12+objects[i].properties.sausages_more_12;
            };
            ob.clusters.setClusterOptions(cluster.id, {
                clusterIcons: [{
                    href: 'images/pie.php?sausages='+sausages+"&sausages_6="+sausages_6+"&sausages_6_12="+sausages_6_12+"&sausages_more_12="+sausages_more_12,
                    size: [65, 65],
                    offset: [-22.5, -22.5]
                }]
            });
        }

    });
  return ob;
}
И перед началом отрисовки меток, настроим кластеризацию:
 // настройки кластеризакции
    objectManager = new ymaps.ObjectManager({
        gridSize: 120,
        clusterDisableClickZoom: true,
        geoObjectOpenBalloonOnClick: true,
        minClusterSize: 2,
        showInAlphabeticalOrder: false,
        viewportMargin: 128,
        zoomMargin: 0,
        clusterize: true
    }); //кластеризуем

    objectManager=SetClusterProp(objectManager);
    myMap.geoObjects.add(objectManager);
...
objectManager.add(массив_объектов);
В результате получим что-то вроде:
